A key aspect of Scrum is its ability to quickly adjust to chaos created by a rapidly changing business model. In projects with ambiguous user requirements and significant potential for frequent changes, Scrum provides considerable advantages over other development models.
To determine whether the justification or viability of executing the project continues to exist, business value should be assessed regularly. Frequent assessment of investment in the project relative to business value being created qualifies the continued viability of a project. The expected requirements from the project may change frequently, which can impact both project investment and value creation.
Monitoring the rate of delivering value is an important requirement for Scrum projects. Periodically tracking and reporting the creation of value assists in assessing project status and provides important information to the customer and other stakeholders.
Let us discuss two of the most popular tools/techniques used in Scrum for continuous business value justification:
- Earned Value Analysis: Although commonly used, tools such as bar charts and Gantt Charts have limitations in tracking and reporting progress when it comes to project performance. Earned Value Analysis (EVA)is used for this purpose.
EVA analyzes actual project performance against planned performance at a given point in time. For tracking techniques to be effective, the initial baseline project plan needs to be accurate. EVA often uses graphs and other visuals (e.g., S-curve), as a way to depict project status information.
Earned Value Analysis measures current variances in the project’s schedule and cost performance and forecasts the final cost based on the determined current performance. EVA is typically done at the end of each Sprint after the User Stories in Sprint Backlog are completed.
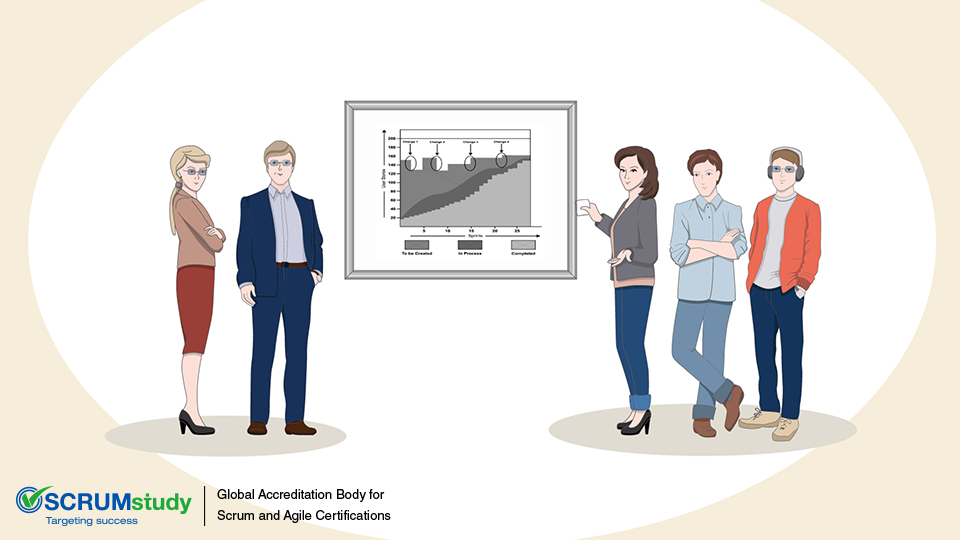
- A Cumulative Flow Diagram (CFD): CFDis another useful tool for reporting and tracking project performance. It provides a simple, visual representation of project progress at a particular point in time. It is usually used to provide a higher level status of the overall project and not daily updates for individual Sprints.
The figure above is an example of a CFD for a large project. It shows how many User Stories are yet to be created, in process of being created, and have been created. As customer requirements change, there is a change in the Cumulative User Stories which have to be delivered. Change points 1 and 2 are where the Product Owner removed existing user Stories and Change points 3 and 4 are where the Product Owner added new User Stories in the Risk Adjusted Prioritized Product Backlog.
This type of diagram can be a great tool for identifying roadblocks and bottlenecks within processes. For example, if the diagram shows one band becoming narrower while the previous band is becoming wider over time, there may be a bottleneck and changes may be needed to increase efficiency and/or improve project performance.