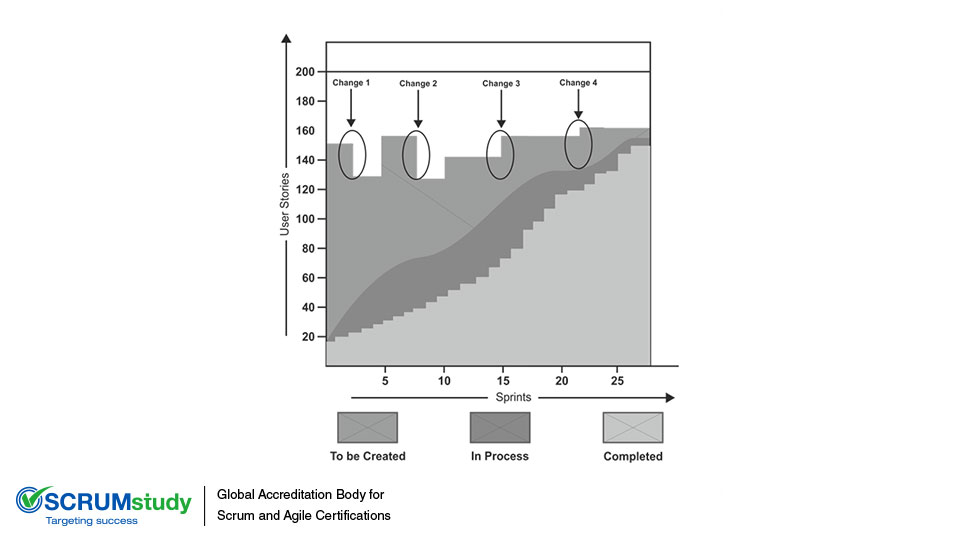
A Cumulative Flow Diagram (CFD) is a useful tool for reporting and tracking project performance. It provides a simple, visual representation of project progress at a particular point in time. It is usually used to provide a higher level status of the overall project and not daily updates for individual Sprints. The image above is an…