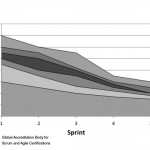
A burn down chart is a simple graph used to track a team’s progress and help estimate how much time is required to complete the project. The number of tasks remaining in the project is usually plotted on the y-axis, while time is plotted on the x-axis.
An advantage of a burn down chart is that they are simple to read and allow us to easily track the progress of a project. However, a burn down chart does not explain why work may have been delayed. For example, the graph might show a lag during the month of November, but that might have been due to several team members taking time off for the holiday or there may have been additional tasks to complete. Another limitation of a burn down chart is that we can only plot the tasks that have been completed so far and not those that are works in progress (WIP).
To overcome the limitations of using a burn down chart, you can include more information when you use a cumulative flow diagram that presents scope.
 In a cumulative flow diagram (CFD), we can plot the total backlog at the beginning of the project, work in progress and tasks that have been completed. The features are plotted on the y-axis, while time is plotted on the x-axis. CFDs are more informative visually and are at the same time simple to create and update.


